
The AI Workforce Numbers Anyone Can Check
We're committed to providing opportunities for everyone in our community to learn and flourish with AI.
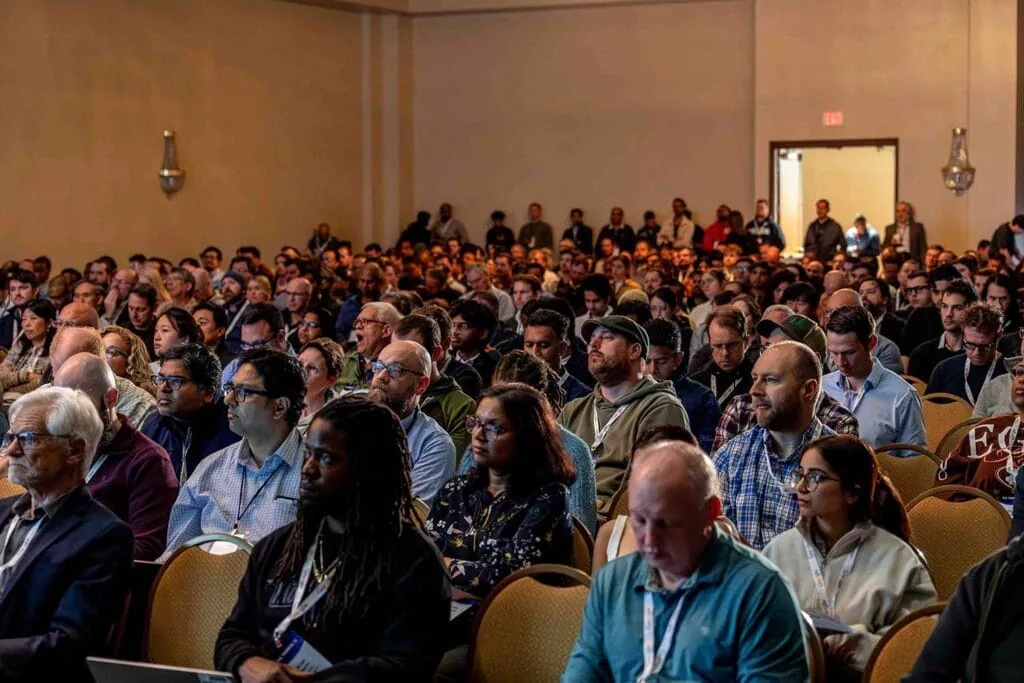
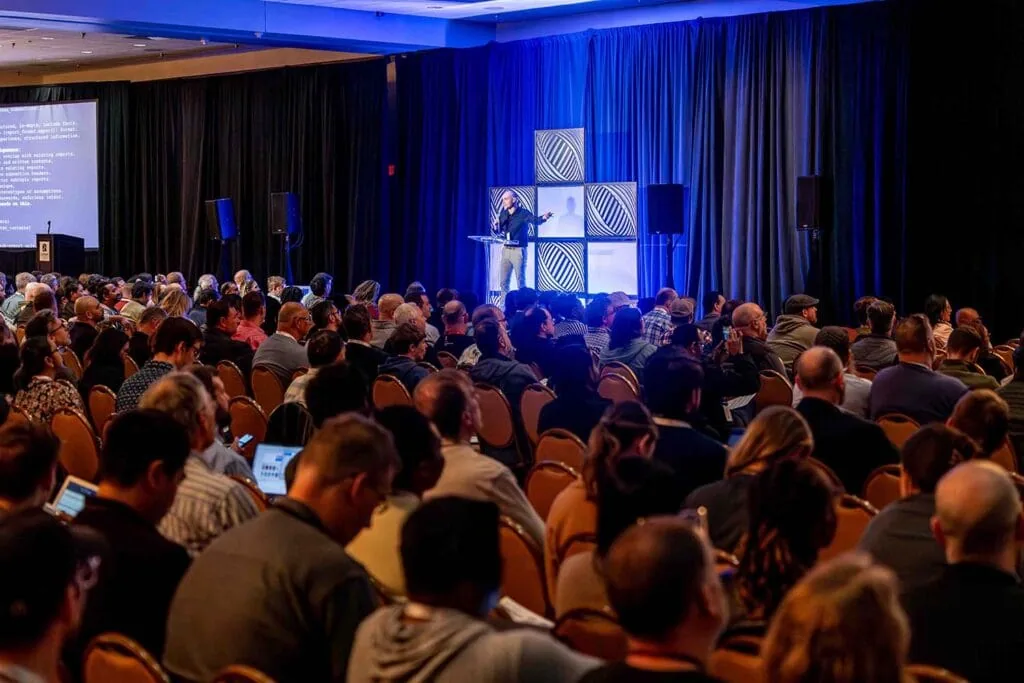
Training delivered to date
A company deciding where to land asks one question: how many people within driving distance can already do this work, and how many more can you produce a year? This page is our running answer.
Who the training reaches
Ninety percent of the audience lives in North Carolina, and no single city holds even a quarter of it — the audience is the Research Triangle itself, spanning Wake, Durham, and the towns in between. These are residents who take the training back to jobs here on Monday.
What the free seats actually cost
Free training isn't free to deliver. Both conferences returned no profit to their organizers, and the free program has been funded privately for its entire existence.
Methodology
Every count on this page is drawn from Eventbrite registration and ticketing records for the All Things AI event portfolio, March 2025 – November 2026, covering all non-cancelled, non-refunded registrations. Unique people are counted by registration email. Employers are distinct employer names supplied at registration. Geographic figures cover the 5,551 registrations carrying a valid five-digit US ZIP code.
The face value of free admissions is the published ticket price of each comped seat at the time it was issued. The cash cost of the free program is out-of-pocket spending from the organizers' line-item event budget. Meetup membership is reported by Meetup.com group records; webinar figures come from WebinarJam registration reports.
This page is updated quarterly, and the figures are frozen as of the verification date shown above. Where we're headed: a direct query link against the underlying database — likely with an API key — so you can run the numbers yourself instead of trusting a snapshot. Until then, the underlying data is available to economic development offices and site selectors on request via our contact page.
Every figure on this page comes from registration records, not estimates. Data window March 2025 – November 2026 · last verified September 5, 2026.